Problem Description:
This statistical analysis assignment aims to explore the "hostile mediator phenomenon" (HMP), a broader concept related to the well-known "hostile media phenomenon" (HMP) where rival partisans perceive various public institutions as biased against their sides. The dataset focuses on Facebook bias perceptions among Democrats and Republicans, and gender differences in perceived bias about President Trump.
1. Facebook Bias Perceptions among Democrats and Republicans
| Variable name in the dataset | What was measured | Possible responses | Scale of measurement |
|---|---|---|---|
| gender | Gender | 0 = Male 1 = Female |
Nominal |
| facebook_item | Facebook bias | The range of answers is between 1 to 9, with: 1 = Bias in favour of Trump 5 = Neutral 9 = Bias against Trump |
Quasi-interval (Continuous) |
| partisan_group | Partisan groups | 0 = Democrats 1 = Independents / Other 2 = Republican |
Nominal |
Table 1: Bias perceptions on both Democrats and Republicans
The researcher wanted to know whether Republicans and Democrats (separately) perceive a bias in favour or against President Trump on Facebook (facebook_item). To test his hypotheses, please execute the following six steps:
Solution
Hypothesis Testing Steps:
- Exclude non-Democrats.
- Test if Democrats' Facebook bias significantly differs from neutrality.
- Cancel the filter.
- Exclude non-Republicans.
- Test if Republicans' Facebook bias significantly differs from neutrality.
- Cancel the filter.
1. Researcher's Hypothesis: The researcher's hypothesis is two-tailed, as it posits that Democrats' Facebook bias can be either lower or higher than neutrality (5).
2. Test Conducted in b and e: One sample t-test was conducted.
3. Results of Tests for Democrats and Republicans: Democrats:
- Mean: 4.86, SD: 0.085, Sample Size: 787
- Result: No significant difference from 5 (p = 0.1037).
Republicans:
- Mean: 6.28, SD: 0.094, Sample Size: 787
- Result: Significant difference from 5 (p < 0.0001).
Summary Statistics
| Mean |
4.8614994 |
| Std Dev |
2.3852557 |
| Std Err Mean | 0.0850252 |
| Upper 95%Mean |
5.0284027 |
| Lower 95%Mean | 4.6945961 |
| N | 787 |
Test Mean
| Hypothesized Value |
5 |
| Actual Estimate | 4.8615 |
| DF | 786 |
| Std Dev | 2.38526
|
t Test
| Test Statistic |
-1.6289 |
| Prob >It | 0.1037 |
| Prob >t | 0.9481 |
| Prob |
0.0519 |
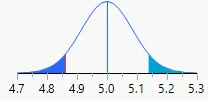
Table 4: Test for Democrats and Republicans
4. Interpretation: For Democrats, bias perception is neutral. Republicans perceive a significant bias against Trump on Facebook.
2. Gender Differences in Facebook Bias
The researcher wanted to test for gender differences in perceived bias on Facebook for or against Trump (facebook_item)
The researcher wanted to test for gender differences in perceived bias on Facebook for or against Trump (facebook_item)
- Test Required: Two independent t-tests.
- Test Results: Levene’s test showed unequal variances. Independent t-test: no significant difference (p = 0.0888).
- Report on Test Results: Men and women have a similar perception of Facebook bias related to Trump (Male: M = 5.68, Female: M = 5.47).
- N Discrepancy Explanation: The N value is lower due to missing values in Facebook bias.
3. Comparative Analysis of Traumatic Event Experiences
The following table presents the results of comparisons between means of parents and their adolescent children in their experience of traumatic events.
All quantitative variables were tested on a scale of 1 (Low) to 7 (High).
| Variable name in the dataset | What was measured | Possible responses | Scale of measurement |
|---|---|---|---|
| gender | Gender | 0 = Male 1 = Female |
Nominal |
| facebook_item | Facebook bias | The range of answers is between 1 to 9, with: 1 = Bias in favour of Trump 5 = Neutral 9 = Bias against Trump |
Quasi-interval (Continuous) |
| partisan_group | Partisan groups | 0 = Democrats 1 = Independents / Other 2 = Republican |
Nominal |
Table 5: A scale to compare the quantitative variables
- Tests Conducted: Two independent t-tests.
- Significant Results: Three significant differences in exposure, individual resilience, and self-differentiation.
- Analysis for 'Individual Resilience': Significant difference (p < 0.05). Parents show slightly higher resilience (M = 3.94) compared to adolescents (M = 3.73).
- Analysis for 'Family Resilience': No significant difference (p > 0.05). Parents and adolescents exhibit similar family resilience.
- Interpretation of p-value (for 'Self-Differentiation'): Significant difference (p < 0.05). Adolescents (M = 4.45) self-differentiate more than parents (M = 4.23).