Problem Description:
The survival analysis assignment involves the analysis of a dataset representing the angular movement of wind direction in four seasons: Spring, Summer, Autumn, and Winter. The dataset provides descriptive statistics and visualizations to understand the patterns in wind direction during different seasons.
Solution:
a. Descriptive Statistics of Wind Direction:The dataset was successfully loaded, and the summary statistics for the angular measures of wind direction in degrees for each season are as follows:
| Spring | Summer | Autumn | Winter | |
|---|---|---|---|---|
| Min. | 0.0 | 10.00 | 30.0 | 50.0 |
| 1st Qu. | 55.0 | 20.00 | 155.0 | 205.0 |
| Median | 185.0 | 35.00 | 215.0 | 255.0 |
| Mean | 176.7 | 80.83 | 200.0 | 238.3 |
| 3rd Qu. | 275.0 | 150.00 | 260.0 | 297.5 |
| Max. | 350.0 | 190.00 | 350.0 | 340.0 |
| IQ Range | 220.0 | 130.00 | 105.0 | 92.5 |
| Std.dev. | 123.97 | 72.92 | 94.00 | 86.64 |
Table 1: The angular measures of wind direction in degrees.
b. Interpretation:
All the descriptive statistics are within the plausible range of degrees (0 to 360), indicating a meaningful representation of wind direction. The summary statistics do not contain values outside the possible degree ranges.
c. Plot of Angular Measure:
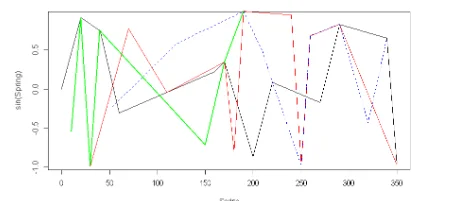
Diagram 1: Plot of angular measure of season
The plot illustrates the angular movement of wind direction in Spring, Summer, Autumn, and Winter. Despite seasonal variations, the wind direction exhibits a consistent pattern across all four seasons.
d. Normal Q-Q Plots for Sample Size Variation:
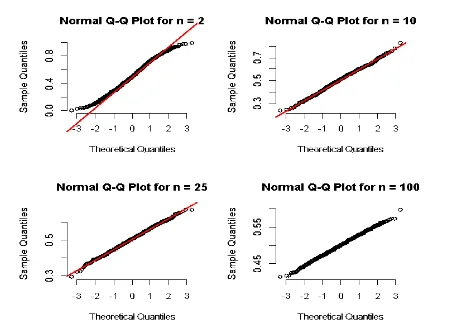
Diagram 2: different curves of the normal Q-Q Plot on different sizes
R code snippets demonstrate the normal distribution tendency of sample means as the sample size increases. The plots clearly show that as the sample size grows from 2 to 100, the distribution of the sample mean approaches normality.
e. Bike Trip Analysis:
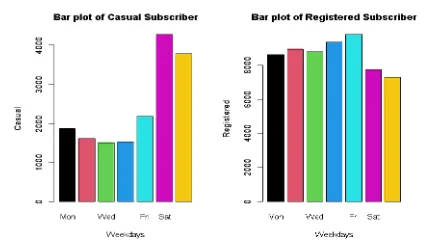
Diagram 3: The bar plot of subscribers against the respective days of the week.
Trip Duration: The longest rental duration is 8.98 days, and no single trip lasted more than 23 hours.
Trip Origin and Destination:
- Most trips originate from Massachusetts Ave & Dupont Circle NW (1,595 trips).
- The majority of trips end at the same station, Massachusetts Ave & Dupont Circle NW.
Return Status: No bikes were reported as not returned.
f. Bar Plots of Casual and Registered Subscribers:
Bar plots reveal a decrease in the number of casual subscribers during weekdays and an increase during weekends. In contrast, registered subscribers show an increase on weekdays and a decrease on weekends.
Titanic Passenger Analysis:
a. Passenger Class Distribution:
| 1st | 2nd | 3rd | |
|---|---|---|---|
| Female | 143 | 107 | 212 |
| Male | 179 | 173 | 499 |
b. Survival Analysis:
Detailed analysis of survival rates for passengers based on gender and class is presented. Notable findings include the number of passengers in each class, survival counts, and comments on survival patterns.
c. Mean Differences in Ages for Men and Women:
The mean age differences for survived and non-survived passengers are calculated, and t-tests are performed. The results indicate significant age differences between survived and non-survived passengers for both men and women.
In conclusion, the assignment provides a comprehensive analysis of seasonal wind direction data, bike trip statistics, and insights into survival patterns on the Titanic. Visualizations and statistical tests enhance the interpretation of the findings.