Problem Description:
The statistical analysis assignment study aims to compare the effectiveness of a new weight loss plan (VLCD) with a traditional one. The null hypothesis suggests no difference in weight loss between the two plans, while the alternative hypothesis proposes a significant difference.
1. Hypothesis Statements:
- Null Hypothesis: The new weight loss plan is the same as the traditional one (μ_new=μ_traditional).
- Alternative Hypothesis: The new weight loss plan is not the same as the traditional one (μ_new≠μ_traditional).
2. Data Set: Please find attached a copy of the spreadsheet.
3. Descriptive Statistics and Normality Check:
Descriptive statistics and histograms were generated for both diet types. The average weight loss for the Traditional VLCD Plan is 10.55 (SD=3.3878), and for the new plan is 12.1 (SD=2.438). The kurtosis and skewness indicate normality for the traditional plan, while the new plan shows a skewed distribution.
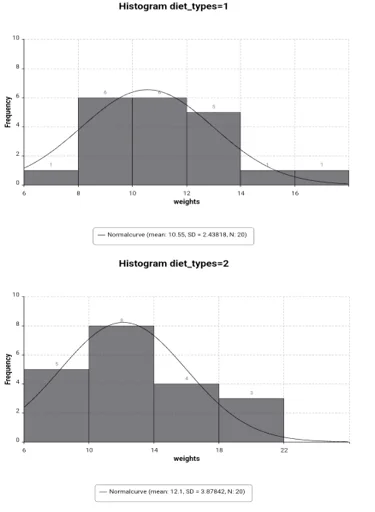
Chart 1: The frequency of the histogram diet vs. weights
4. Kolmogorov-Smirnov (KS) Test:
- Null Hypothesis: The data is normally distributed.
- Alternative Hypothesis: The data is not normally distributed.
- Result: Since p-value (0.381) > 0.05, we do not reject the null hypothesis, concluding that the data is normally distributed.
5. t-Test for Two Independent Samples:
- Levene Test suggests unequal variances (p=0.0777).
- A two-sided t-test (p=0.139) indicates no significant difference in weight loss between the traditional and new plans.
6. Type I and Type II Errors:
- Type I Error: Falsely rejecting the null hypothesis.
- Type II Error: Failing to reject the null hypothesis when it is false.
- Prevention: Minimize α, maximize the power of the test.
Conclusion
After analysis, no significant difference was found between the two plans. To enhance the study's power and significance, increasing the sample size, using a directional test, and addressing potential confounding variables (exercise, age, sex, smoking) are recommended.