Problem Description:
Fraudulent insurance claims pose a significant challenge, consuming valuable resources and costing companies substantial financial losses. This paper addresses this issue through a statistical fraud detection framework applied to insurance claims using linear regression using Excel assignment. The model, employing multiple linear regression, analyzes customer data, including variables such as annual income, marital status, age, and more, to identify potential fraud instances.
Data Selection: A random sample of 8,000 data points was selected from a pool of approximately 9,000 for model development.
Model Development: Variable selection is crucial in building an effective linear regression model. After exploring various variables against fraudulent frequency, the following were chosen:
- Claim Amount
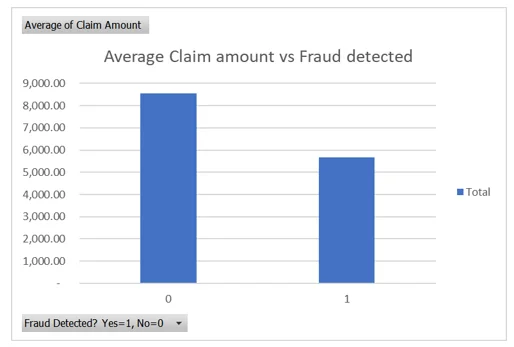
Chart 1: An analysis of the average claim amount used in the regression model
- Employment status
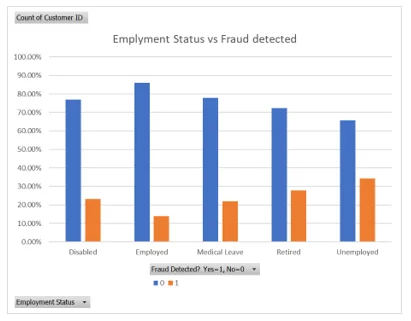
Chart 2: Employment status vs. fraud detection
- Age
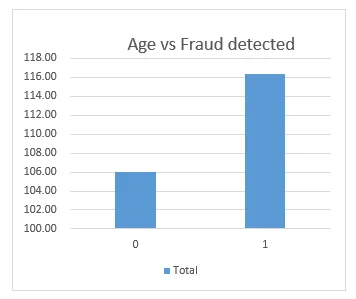
Chart 3: Age vs. fraud detection
- Annual income
| Fraud |
Average of Annual Income ( $ ) |
| 0 | 41,017.28 |
| 1 | 23,802.24 |
| Grand Total | 37507.57 |
Table 1: The average annual income vs. fraud detection
- Monthly Premium
- Marital Status (Single)
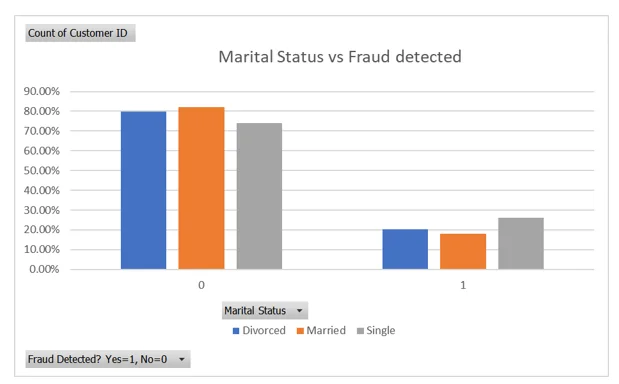
Chart 4: Marital status vs. fraud detection
Model Results:
The multiple regression model explained approximately 19.4% of the variation in fraud using the selected regressors. The model was statistically significant (F = 275.34, p < 0.001), indicating its efficacy in predicting fraud likelihood. While marital status (single) and employment status were statistically insignificant, they were retained in the model due to similar adjusted R-squared values.
Prediction of Fraud:
The likelihood of fraud was predicted using the estimated equation, provided below. A higher value signifies a greater likelihood of a fraudulent claim.
y ̂=0.697-0.012×Age+0.0003×Montly Premium-0.0000098×Claim Amount-0.000024×Annual Income+0.002×I(Single)+0.063×I(Unemployed)+0.039×I(Retired)
Investigation Decision Rule:
The threshold for fraud investigation was optimized through a cost function. The model suggests a threshold of 0.25, resulting in 3,350 investigations and a total cost of $4.94 million to the firm.
| Threshold | Investigated? | Non-Fraud Investigated | Fraud Not Investigated | Cost |
|---|---|---|---|---|
| 0.1 | 5785 | 4195 | 41 | $ 5,990,000 |
| 0.15 | 5106 | 3555 | 80 | $ 5,506,000 |
| 0.2 | 4231 | 2783 | 183 | $ 5,146,000 |
| 0.25 | 3350 | 2037 | 318 | $ 4,940,000 |
| 0.3 | 2463 | 1360 | 528 | $ 5,103,000 |
| 0.35 | 1731 | 846 | 746 | $ 5,461,000 |
| 0.4 | 1076 | 432 | 987 | $ 6,011,000 |
| 0.45 | 619 | 218 | 1230 | $ 6,769,000 |
| 0.5 | 344 | 100 | 1387 | $ 7,279,000 |
| 0.55 | 112 | 15 | 1534 | $ 7,782,000 |
| 0.6 | 0 | 0 | 1631 | $ 8,155,000 |
Table 2: The cost of investigation of fraud on the firm
Model Evaluation:
Comparing the model-based recommendation to a random decision model:
- Total Investigated: 3,350
- Investigation Cost: $3.35 million
- Fraud Cost: $4.775 million
- Total Cost: $8.125 million
- Cost from Regression: $4.94 million
- Money Saved: $3.185 million
The regression model's cost was $3.185 million lower, demonstrating a 64.5% cost reduction compared to the random decision model.
Areas of Improvement:
- Consider using logistic regression for binary response variables.
- Explore penalized methods or best subset selection for more optimal variable selection.
- Incorporate higher-order terms to capture additional variation in the data.