Problem Description:
The statistical analysis with Excel aims to investigate the perceived usability of a neuroanatomy tool among medical students compared to undergraduate students. The research question focuses on whether medical students perceive the tool to be more usable for their studying than undergraduates. The variables of interest include the independent variable, "use of the tool" (ordinal), and the dependent variable, "percent level of usability" (ratio).
- Independent Variable: Use of tool (Ordinal)
- Dependent Variable: Percent level of usability (Ratio)
2. Research Question: What is the research question?
- Does the neuroanatomy tool's usability differ between medical students and undergraduates?
3. Research Hypothesis: What is the research hypothesis?
- Medical students perceive the neuroanatomy tool as more usable for studying than undergraduate students.
4. Statistical Hypotheses:
- Null Hypothesis: The mean percentage perceived usability of the neuroanatomy tool is the same for medical students and undergraduates.
- Alternative Hypothesis: The mean percentage perceived usability of the neuroanatomy tool is greater for medical students than undergraduates.
5. Sample Size Estimation:
- Sample size needed: 50 (adjusted for migration bias).
6. Data Collection/Extraction:
- A simple random sample of size 50 from both graduate and undergraduate students.
7. Descriptive Statistics:
- Descriptive statistics for samples:
| samples | Undergraduate | Graduate |
|---|---|---|
| Mean | 59.59 | 58.65 |
| Standard Deviation | 11.39 | 9.26 |
Table 1: Descriptive statistics for mean and standard deviation.
- Normal Distribution Check: The samples appear to be approximately normally distributed.
8. Test of Significance:
- Selected Test: Independent sample t-test.
- P-value: 0.6733
- P-value Interpretation: Fail to reject the null hypothesis.
- Statistical Hypothesis Tested: Null Hypothesis
9. Interpretation of Results:
Since p-value (0.6733) > 0.05, we fail to reject the null hypothesis. Concluding that the mean percentage perceived usability of the neuroanatomy tool is the same for medical students and undergraduates.
10. Statistical Power:
- When to Conduct: When there's a high chance of failing to reject a false null hypothesis. b) Statistical Power: Probability of rejecting a false null hypothesis (Power = 0.673). c) Enough Power? No, the power in the test is not sufficient.
- Hypothetical Conclusion: Without enough power, confidence in results is compromised. Resolution involves increasing the sample size or re-evaluating the study design.
PART II
Problem Description:
In this segment of the assignment, the focus shifts to investigating whether the perception of usability changes over time, specifically throughout 12 lectures. The objective is to understand how students' familiarity with the tool evolves and if it influences their usability perception.
11. Data Collection/Extraction:
- A random medical student (ID=30) was selected for analysis. The student's usability scores over 12 lectures are as follows:
| Undergraduate Student ID | Lec 1 | Lec 2 | Lec 3 | Lec 4 | Lec 5 | Lec 6 | Lec 7 | Lec 8 | Lec 9 | Lec 10 | Lec 11 | Lec 12 |
|---|---|---|---|---|---|---|---|---|---|---|---|---|
| 30 | 54 | 58 | 61 | 68 | 67 | 67 | 67 | 65 | 64 | 65 | 58 | 55 |
Table 2: Undergraduate student analysis of scores over lecturers
12. Display the Data:
- A scatter plot of usability scores for the selected student is displayed below.
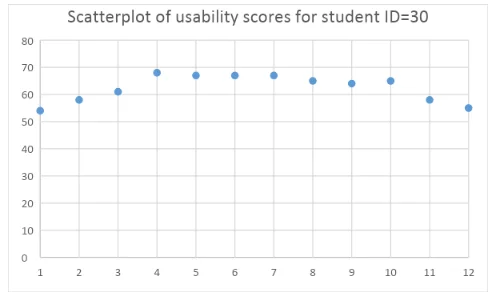
Chart 1: scatterplot of usability scores
13. Interpret the Scatterplot:
- The scatterplot suggests an initial increase in usability scores with lectures, followed by a slight decrease. However, the overall trend indicates that the perception of usability does not consistently increase over the 12 lectures.
14. Measure the Association:
- What is a correlation coefficient?
A correlation coefficient measures the linear relationship between two variables.
- Calculate the correlation coefficient using Excel:
Correlation coefficient = 0.0327
- Report the r and its P-value: - r = 0.0327
-P-value (Right-tailed) = 0.4599
15. Interpretation of Results:
- The correlation coefficient of 0.0327 indicates a negligible positive correlation between lecture numbers and the perception of usability. The P-value of 0.4599 suggests that even if the actual correlation coefficient is 0, there is a 45.99% probability of obtaining a correlation of 0.0327 or more from a random sample (n=12) just by chance.
This analysis provides insights into the relationship between lecture progression and the perceived usability of the neuroanatomy tool, suggesting a limited impact of lecture number on usability perception.
PART III
Problem Description:
In this section of the assignment, the objective is to explore the factors influencing the usability scores of medical students using a neuroanatomy tool for learning. The study considers variables such as mathematical spatial ability skills, gender, social sciences knowledge, and reading comprehension, aiming to identify their impact on usability.
16. Identify the Variables:
- Dependent Variable:
Usability scores of medical students (Ratio Scale).
- Independent Variables:
Math score (Ratio Scale)
Female (Ordinal Scale, dummy coded)
Social studies score (Ratio Scale)
Reading score (Ratio Scale)
17. Research Question:
- Does mathematical spatial ability skills, gender, social sciences knowledge, and reading comprehension influence the usability scores of medical students using the neuroanatomy tool?
18. Research Hypothesis:
- There is a relationship between mathematical spatial ability skills, gender, social sciences knowledge, reading comprehension, and the usability scores of medical students using the neuroanatomy tool.
19. Statistical Hypotheses:
- Null Hypothesis:There is no relationship between independent variables and the usability scores of medical students.
- Alternative Hypothesis:There is a statistically significant linear relationship between independent variables and usability scores of medical students.
20. Data Interpretation:
Multiple Regression Analysis:It studies the linear relationship between a dependent variable and more than one independent variable.
Significantly Associated Independent Variables:Math score (P-value=0.000) - Reading score (P-value=0.000)
Correlation between Dependent and Significant Independent Variables:
- Math score (Correlation=0.368)
- Moderate positive correlation
- Reading score (Correlation=0.347)
- Moderate positive correlation
Influence of Gender on Usability:Gender does not influence the perception of usability (non-significant coefficient).
Multiple R2 Value:It is a measure of variance explained in the dependent variable by independent variables.
R2 Value in this Study: - R2 = 0.489
Interpretation of R2 Value:48.9% of the variance in usability scores is explained by the independent variables.
Conclusion:
As mathematical spatial ability skills and reading comprehension are statistically significant, it is concluded that these factors significantly influence the perception of usability among medical students using the neuroanatomy tool.