Problem Description:
The objective of this analysis using JMP is to predict the rent per square foot lease for commercial properties based on various building and land characteristics. The dataset comprises 225 commercial rental properties available in the market over the last two years. The goal is to identify key factors influencing rent per square foot and develop a marketing plan to optimize property revenue.
Executive Summary:
We conducted a comprehensive analysis, leveraging multiple regression, to understand the intricate relationships between property characteristics and rent per square foot. The following key findings and strategies were derived:
Baseline Property:
- Lease: 2 years
- Square Footage: 40,000 sq. ft.
- Renovation: Newly renovated and wired
- Location: City nearest to the airport
- Occupancy: 100%
The predicted rent per square foot for this baseline property is $35.86, contributing $1,434,400 to revenue.
Factors Influencing Rent Per Square Foot Lease:
- Renovation, location, occupancy, wiring, distance to the airport, parking availability, lease length, and city as a location.
- The model predicts rent for 84.36% of properties within ±$0.73, totaling within ±$106 million.
Discounts and Premiums for Optimization:
- Newly renovated properties command a premium of $16 per square foot.
- City properties have a premium of $7 per square foot over suburban ones.
- Increasing parking to 0.25% of lease space raises rent by $6 per square foot.
- Wiring increases rent by $4 per square foot.
- 100% occupancy allows a premium of $7.5 per square foot.
- Extending lease from 2 to 10 years decreases rent by $2.1 per square foot.
- Properties 20 miles away from the airport have a discount of $9.46 per square foot over those 10 miles away.
Detailed Analysis:
Multiple Regression Analysis:
- Assumptions (linearity, homoscedasticity, normality, independence) were validated.
- The model is significant at 1%, explaining 84.36% of variances in rent per square foot.
Key Factors and Impacts:
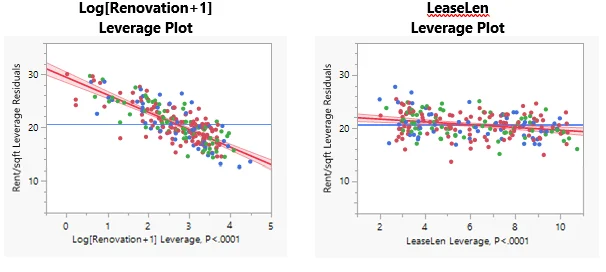
- Renovation (logarithmically transformed) is negatively related to rent per square foot.
- Occupancy has a positive impact on rent per square foot.
- Wiring significantly influences rent positively.
- Distance to the airport, lease length, and location play vital roles.
- Parking availability has a strong positive correlation with rent per square foot.
| Key Factors | β | t-value | p-value |
|---|---|---|---|
| Intercept | 33.748442 | 11.79 | <.0001* |
| Log[Renovation+1] | -3.307854 | ‒18.26 | <.0001* |
| LeaseLen | -0.262133 | ‒4.02 | <.0001* |
| DistAirp | -0.908309 | ‒5.94 | <.0001* |
| Location[CITY] | 6.1781712 | 8.89 | <.0001* |
| Location[SUBNEW] | 0.3822802 | 0.42 | 0.6769 |
| Occupancy | 10.985475 | 8.57 | <.0001* |
| Wiring[NO] | -3.979429 | ‒8.35 | <.0001* |
| 1/SqftLease | -466.0272 | ‒0.26 | 0.7970 |
| 1/SqftLease*Location[CITY] | 6442.2088 | 3.19 | 0.0017* |
| 1/SqftLease*Location[SUBNEW] | 3978.7019 | 1.54 | 0.1239 |
| Parking/SqftLease | 2445.1084 | 5.05 | <.0001* |
| R2 | 0.8436 | ||
| F-value | 108.89* | ||
| p-value | < 0.0001* |
Table 1: Multiple Linear Regression
Conclusion:
The findings provide valuable insights for property owners and managers to optimize revenue by strategically leveraging property characteristics. The suggested discounts and premiums offer actionable strategies to enhance the market positioning of commercial rental properties. Understanding these factors allows for informed decision-making and better profitability in the competitive real estate market.
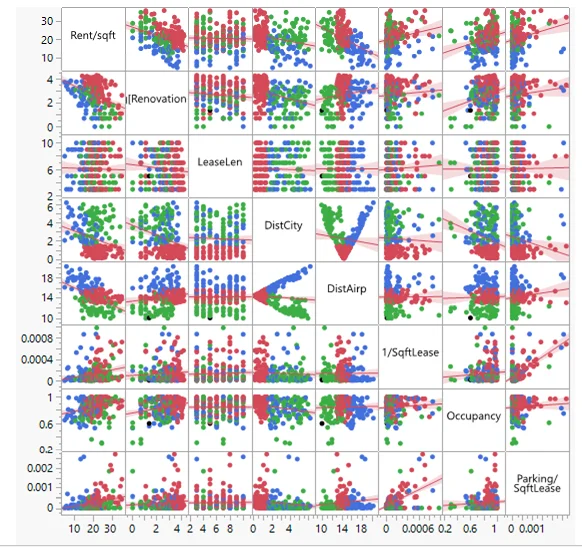
Figure 1: Scatterplot Matrix
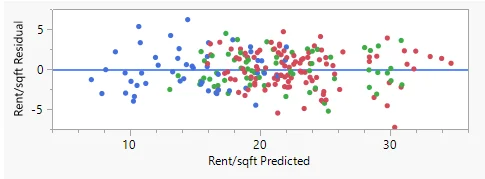
Figure 2: Residual by Predicted Plot
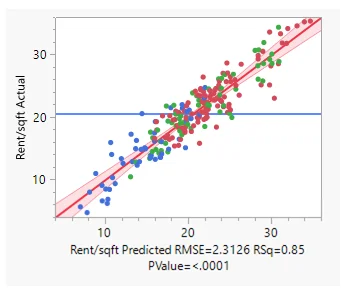
Figure 3: Actual by Predicted Plot