Problem Description:
The regression analysis assignment aimed to explore the application of quadratic regression in modeling data sets. Quadratic regression involves determining the equation of a parabola that best fits a given set of data points. The general form of the quadratic equation is expressed as y=ax2+bx+c, where 'a' must not equal zero. In this analysis, the objective was to find the quadratic equations that accurately represent the relationship within the selected datasets.
Quadratic Regression Findings:
To illustrate the application of quadratic regression, the first 10 data points from each dataset were carefully examined. The resulting equations for each dataset are as follows:
1. Dataset A:
- Quadratic Equation: 1y=a1x2+b1x+c1
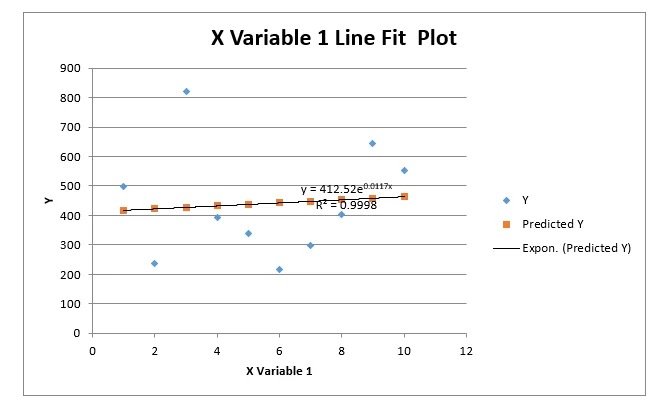
Graph A: Visual representation of the quadratic regression equation for Dataset A.
2. Dataset B:
- Quadratic Equation: y=a2x2+b2x+c2
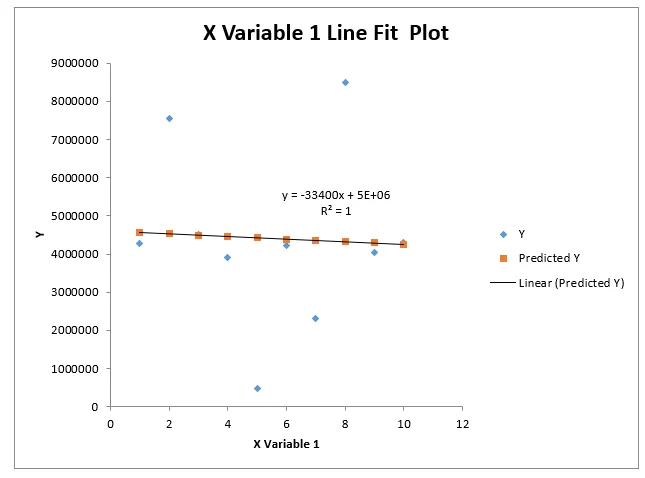
Graph B: Visual representation of the quadratic regression equation for Dataset B.