Problem Description:
The SPSS assignment addresses various statistical scenarios, each requiring the selection of an appropriate test. The objective is to analyze datasets related to college students' behaviours, perceptions, and academic performance using statistical tests such as One-way ANOVA, Multiple Regression, Chi-Square Test of Independence, Dependent samples t-tests, Independent samples t-tests, and Correlation.
- Statistical Test Selections and Explanations
- Test: One-way ANOVA
- Explanation: To determine if work experience during college influences 4-year cumulative GPAs across four groups.
- Test: Multiple Regression
- Explanation: Analyzing how various learning and study strategies predict adult learners' GPA while controlling for demographic variables.
- Test: Factorial ANOVA
- Explanation: Examining whether political affiliation affects the likelihood of having an associate's degree among four-year transfer students.
- Test: Chi-Square Test of Independence
- Explanation: Investigating if the effect of a program differs by gender, determining the joint effect of both factors.
- Test: Dependent samples t-tests
- Explanation: Comparing instructors' efficacy for creating a positive learning climate with instructional strategies within the same group of faculty.
- Test: Independent samples t-tests
- Explanation: Assessing the difference in tutoring hours between first-generation and continuing-generation students.
- Test: Correlation
- Explanation: Investigating the relationship between college GPA and the number of AP classes completed.
- Dataset Analysis Using SPSS
- Test: Pearson Chi-Square Test
- Result: Chi-Square = 1.33, p = 0.249
- Interpretation: Proportion of students living on/off campus is not affected by gender.
- Test: Correlation
- Result: Correlation = -0.167, p = 0.000
- Interpretation: Significant negative relationship; more time studying correlates with less time partying.
- Test: Correlation
- Result: Correlation = 0.529, p = 0.000
- Interpretation: Significant positive relationship; more time socializing correlates with more time partying.
- Dataset Analysis: Sex, Campus Living, and Time Partying
- Test: Interaction Term in Regression Model
- Explanation: To check if differences in time spent partying depend on both sex and campus living situation.
- Randomness of Residuals: Violated
- Sex: p = 0.906 (Not significant)
- First Year Housing: p = 0.064 (Not significant)
- Result: Interaction term p = 0.016 (Significant)
- Interpretation: Time spent partying tends to decrease when gender changes from male to female and housing status changes from on-campus to off-campus.
- Effect Size: 0.238 (Small)
- Analysis of Multiple Regression Model
- Pared (Parents' Education): p-value=0.007 (<0.05), indicating significance.
- Hwork (Time Spent on Math Homework): p-value=0.048 (<0.05), suggesting significance.
- math_selfefficacy (Math Self-efficacy): p-value=0.000 (<0.05), demonstrating significance.
- math_anxiety (Math Anxiety): p-value=0.296 (>0.05), indicating non-significance.
- Variance Explained (r²): 32.7%
- Model Significance: p-value=0.000 (<0.05)
- Normality of Residuals: Residuals are normally distributed.
- Random Distribution Violation: Residuals increase with the increase in the dependent variable, violating the assumption of random distribution.
- True/False Statements
- True
- True
- True
- True
- Relations in Journal of College Student Development Study
- Correlation: -0.215
- Significance: p < 0.01
- Effect Size: Small
- Interpretation: A small negative correlation exists; as career athletic motivation increases, GPA tends to decrease.
- Correlation: 0.353
- Significance: p < 0.01
- Effect Size: Small
- Interpretation: A small positive correlation is observed; higher academic motivation is associated with higher GPA.
- Correlation: -0.118
- Significance: p < 0.01
- Effect Size: Small
- Interpretation: A small negative correlation; as student-athlete motivation increases, GPA tends to decrease.
a. Work Experience and GPA Analysis
b. Learning and Study Strategies Impact on GPA
c. Political Affiliation and Associate's Degree
d. Program Effect on Gender Differences
e. Instructors' Efficacy Comparison
f. Comparison of First-Generation and Continuing-Generation Students
g. College GPA and AP Classes Relationship
________________________________________
A. Relationship Between Living on Campus and Gender
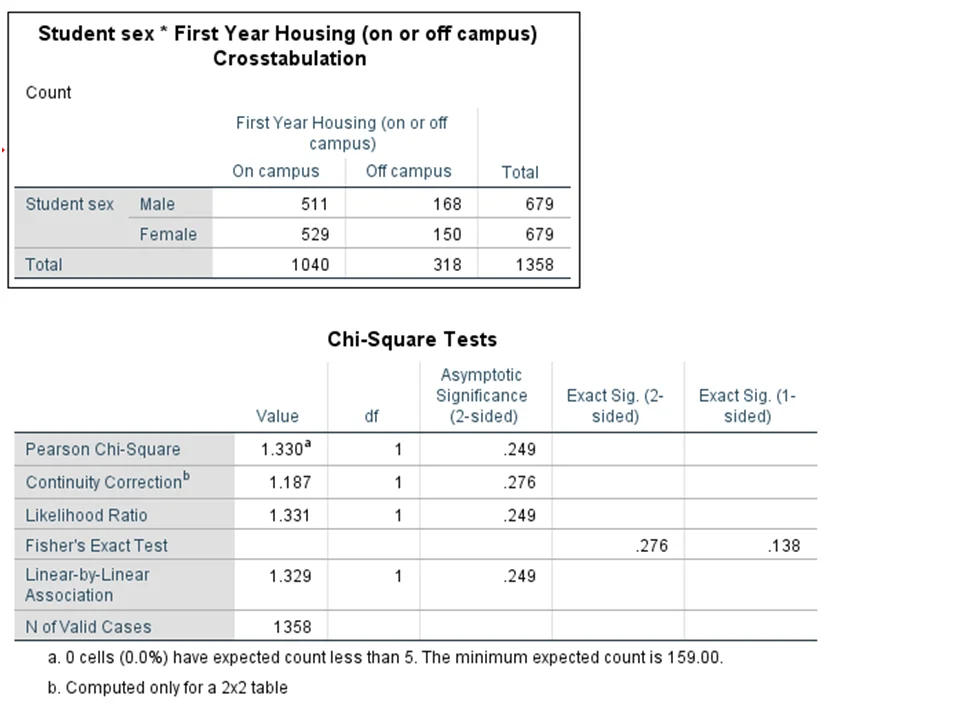
Table 1: The relationship between living in campus and gender
B. Relationship Between Time Studying and Time Partying
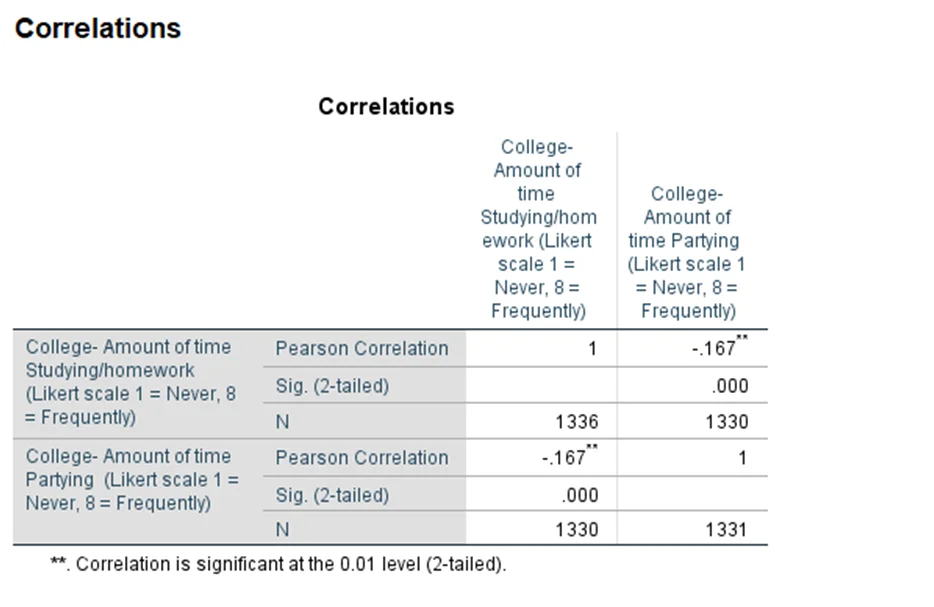
Table 2: Relationship between time partying and time studying
C. Relationship Between Time Socializing and Time Partying
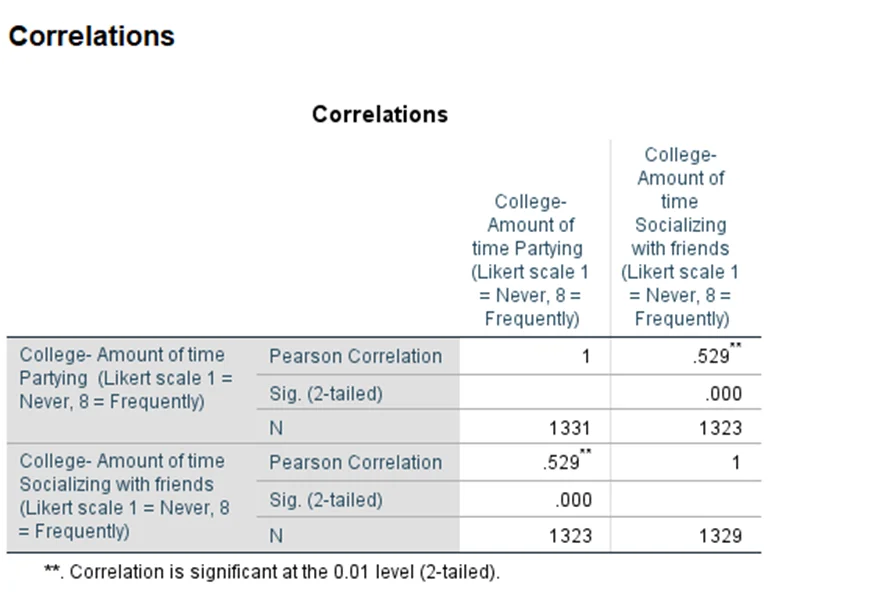
Table 3: Relationship between time partying and time socializing
A. Test Selection for Interaction
B. Assumption Check
C. Main Effects of Independent Variables
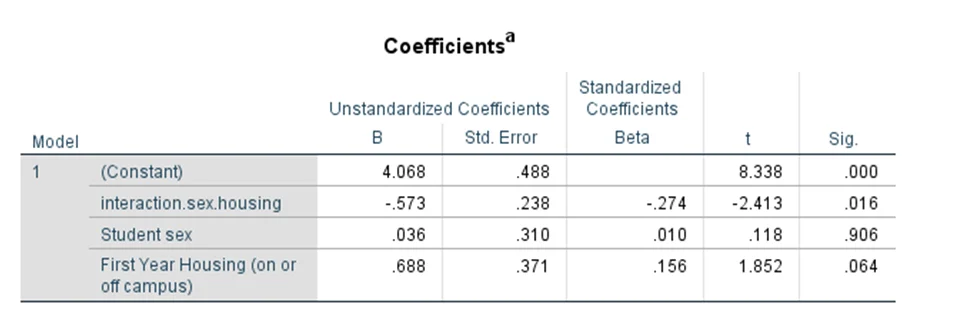
Table 4: Effects of independent and dependent variables
D. Interaction Effect
E. Effect Sizes
A. Significant Predictor Variables
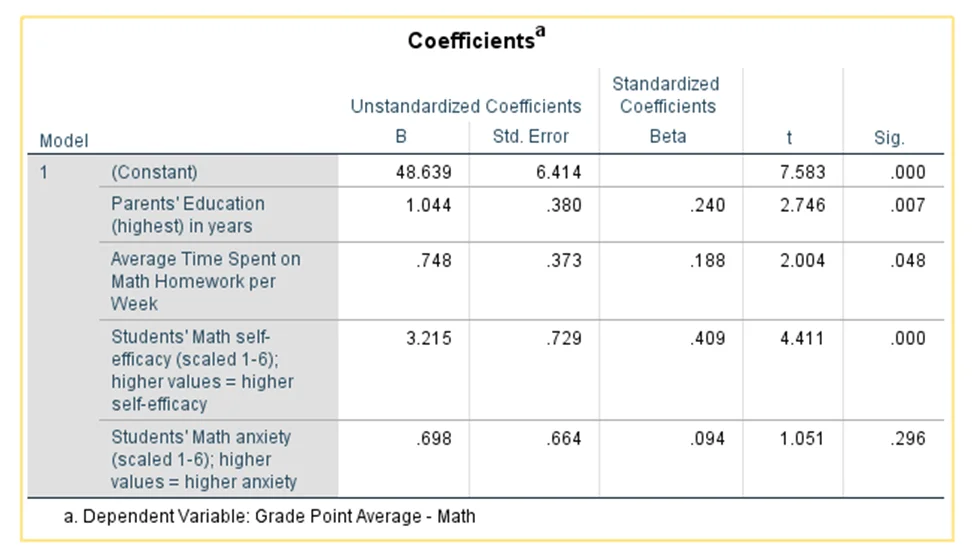
Table 5: predictor variables that influence math grades
Interpretation: The education level of parents, time spent on math homework, and students' math self-efficacy significantly influence math grades. However, math anxiety does not have a significant impact.
B. Variance Explanation and Significance
Interpretation: The model explains 32.7% of the variance in math grades, and the overall model is statistically significant.
C. Assumption Violations
Multicollinearity arises when predictors are highly correlated with other predictors in a multiple regression model.
Assumptions for a chi-square test of independence require cells of expected frequencies to have a sample size of at least five.
In a regression model with a single independent and dependent variable, the standardized beta coefficient is the equivalent to the coefficient of a bivariate correlation between the independent and the dependent variables.
When you have two non-continuous variables, a correlation is the most appropriate statistical test.
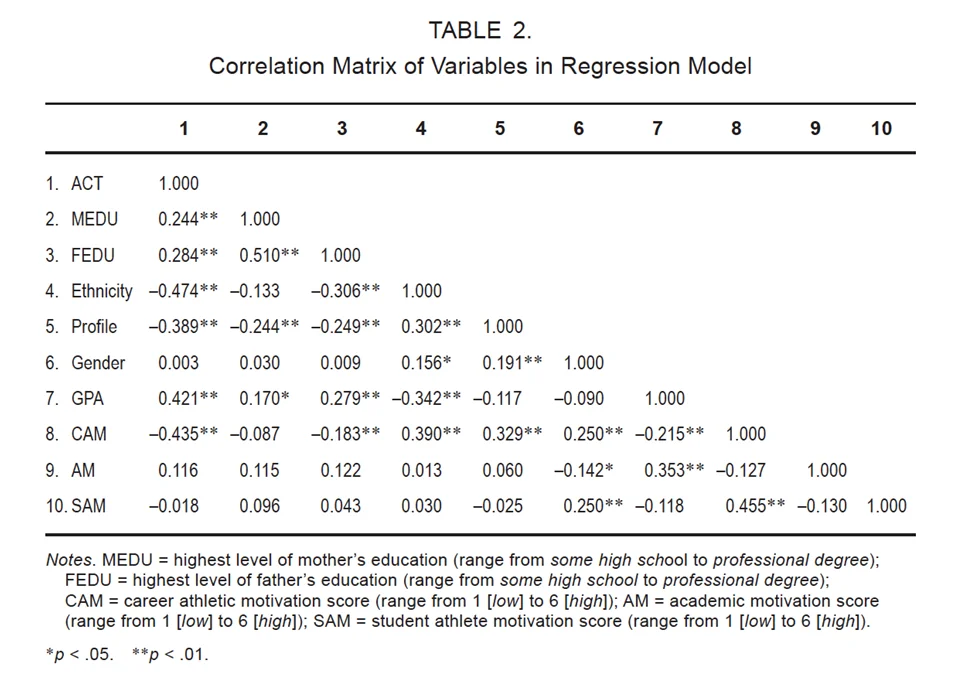
Table 6: correlation matrix of demographic variables
a. GPA and CAM (Career Athletic Motivation Score)
b. GPA and AM (Academic Motivation)
c. GPA and SAM (Student Athlete Motivation)
Extra Credit - Interaction Effect
The figure indicates a significant interaction effect. When low belonging changes to high belonging, the change in the dependent variable is much higher than in the case of the same change in growth mindset for low belonging. This suggests that the impact of belonging on the dependent variable is more pronounced when accompanied by a shift from low to high belonging.