Problem Description:
The statistical analysis assignment addresses statistical analyses related to Glucose and Protein measurements using old and new instruments. Key tasks include detecting Westgard rule breaks, calculating 95% confidence intervals, testing for equality of variances, and examining equality of means.
Q1: Detection of Westgard Rule Breaks
Problem Description:
Identify instances of Westgard rule breaks based on consecutive observations with more than a 4-standard deviation difference.
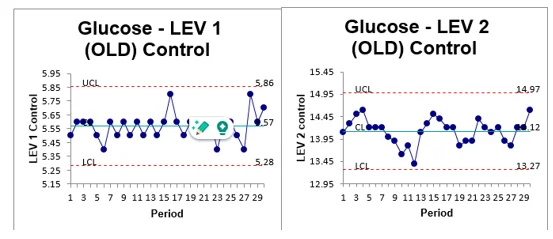
Chart 1: Glucose old level control variations
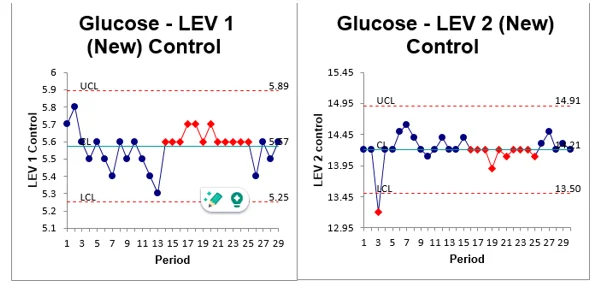
Chart 2: Glucose new level control variations
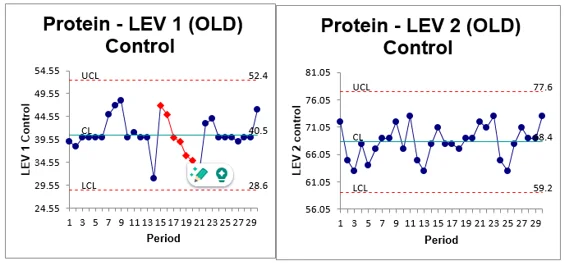
Chart 3: Protein old level control variations
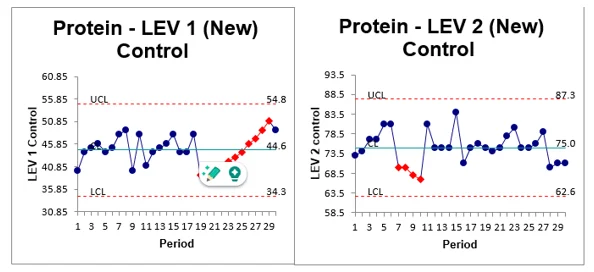
Chart 4: Protein new level control variations
Solution Summary: Two Westgard rule breaks detected - one in Glucose Level 1 from the old instrument and another in Protein Level 1 from old equipment. Three more observations showed exactly a 4-standard deviation difference.
Q2: 95% Confidence Intervals for Each Treatment
Problem Description:
Calculate and present the 95% confidence intervals for different treatments involving glucose and protein levels measured with both old and new instruments.
| Treatment | Lower Level | Upper Level |
|---|---|---|
| Glucose Old Instrument Level 1 | 5.57 | 5.63 |
| Glucose Old Instrument Level 2 | 14.12 | 14.28 |
| Protein Old Instrument Level 1 | 38.93 | 41.07 |
| Protein Old Instrument Level 2 | 66.90 | 69.10 |
| Glucose New Instrument Level 1 | 5.57 | 5.63 |
| Glucose Old Instrument Level 2 | 14.12 | 14.28 |
| Protein New Instrument Level 1 | 42.93 | 45.07 |
| Protein New Instrument Level 2 | 73.90 | 76.10 |
Table 1: Glucose and protein treatments on all levels
Solution Summary: Confidence intervals presented for glucose and protein levels with both old and new instruments, providing a range for each treatment.
Q3: Equality of Variances Test
Problem Description:
Test for equality of variances between old and new instruments for Glucose Level 1 and Level 2, and Protein Level 1 and Level 2.
| Statistics | Glucose | Protein | ||||||
|---|---|---|---|---|---|---|---|---|
| Level 1 | Level 2 | Level 1 | Level 2 | |||||
| Old | New | Old | New | Old | New | Old | New | |
| Standard Deviation | 0.095 | 0.103 | 0.284 | 0.235 | 3.976 | 3.367 | 3.03 | 4.106 |
| F-value | 0.05 | 6.68 | 0.08 | 2.27 | ||||
| p-value | 0.819 | 0.011 | 0.774 | 0.135 | ||||
Table 2: Test for variance equality on glucose and protein levels
Solution Summary: F-tests conducted for equality of variances. Conclusions drawn based on p-values, indicating significant differences in Glucose Level 2 variances between old and new instruments.
Q4: Equality of Means Test
Problem Description: Test for equality of means between old and new instruments for Glucose Level 1 and Level 2, and Protein Level 1 and Level 2.
| Statistics | Glucose | Protein | ||||||
|---|---|---|---|---|---|---|---|---|
| Level 1 | Level 2 | Level 1 | Level 2 | |||||
| Old | New | Old | New | Old | New | Old | New | |
| Mean | 5.571 | 5.571 | 14.12 | 14.21 | 40.53 | 44.64 | 68.3 | 75.00 |
| SD | 0.095 | 0.103 | 0.284 | 0.235 | 3.976 | 3.367 | 3.03 | 4.106 |
| t-value | 0.000 | -1.73 | -6.07 | -10.08 | ||||
| p-value | 1.000 | 0.086 | <.001 | <.001 | ||||
Table 3: Test for means equality on glucose and protein levels
Solution Summary: T-tests conducted for equality of means. Conclusions drawn based on p-values, indicating significant differences in protein measurements for both Level 1 and Level 2, but no significant differences in glucose measurements.