Problem Description:
In this statistical analysis assignment, we analyze various health metrics using statistical measures and visualizations. The data set includes information on Beck Depression Index (BDI), PHQ9 Depression, Body Mass Index (BMI), Pittsburg Sleep Quality Index (PSGI), and Actigraph-measured Total Wake Time.
1. Histogram Analysis:
i. Beck Depression Index (BDI):
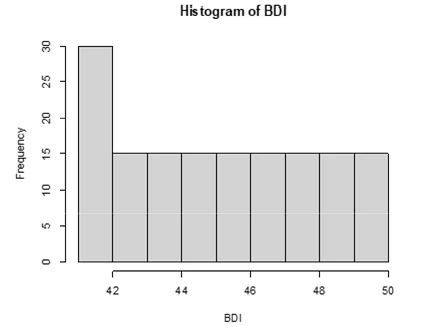
Chart 1: A rectangular-shaped distribution of BDI
- Description: Rectangular distribution, indicating equal frequencies for each BDI value.
- Observation: The histogram exhibits a rectangular shape.
ii. PHQ9 Depression:
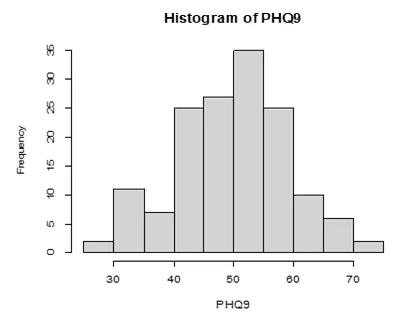
Chart 2: A normal distribution curve of PHQ9
- Description: Roughly normal distribution, showing symmetry or a bell-curve shape.
- Observation: Mean, median, and mode are approximately the same.
iii. Body Mass Index (BMI):
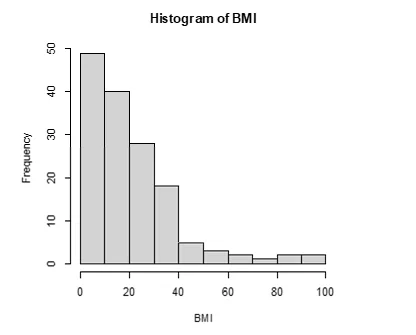
Chart 3: Positively skewed BMI histogram
- Description: Positively skewed, with a longer tail to the right.
- Observation: Mean is greater than median and mode.
iv. Pittsburg Sleep Quality Index (PSGI):
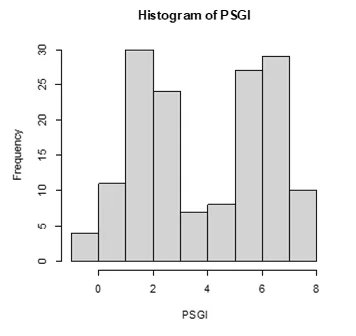
Chart 4: Bi-modal distribution of PBSGI
- Description: Bi-modal distribution with two modes.
- Observation: Mean and median lie between the two modes.
v. Actigraph-measured Total Wake Time:
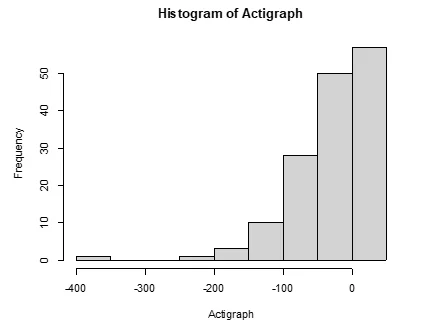
Chart 5: Negatively skewed histogram of actigraph
- Description: Negatively skewed, with a longer tail to the left.
- Observation: Mean is less than median and mode.
2. Correlation Analysis:
ii. & iii. Correlation between Actigraph and Zscore (Actigraph):
- Method: Pearson's product-moment correlation.
- Result: Perfectly positive correlation (r = +1) between Actigraph-measured total wake time and its Z score.
3. Mean and Standard Deviation Analysis:
iv. Mean and Standard Deviation of BDI, PHQ9, BMI, and PSGI:
Observation:
- BDI: Mean = 45.5, Median = 45.5
- PHQ9: Mean = 49.7914, Median = 50.3418
- BMI: Mean = 20.7715, Median = 15.4955
- PSGI: Mean = 4.35, Median = 4
Conclusion: Inconsistency between mean, median, and mode suggests a non-normal distribution for the variables.